
REASON Project Puts Water Quality Instrumentation in Dams
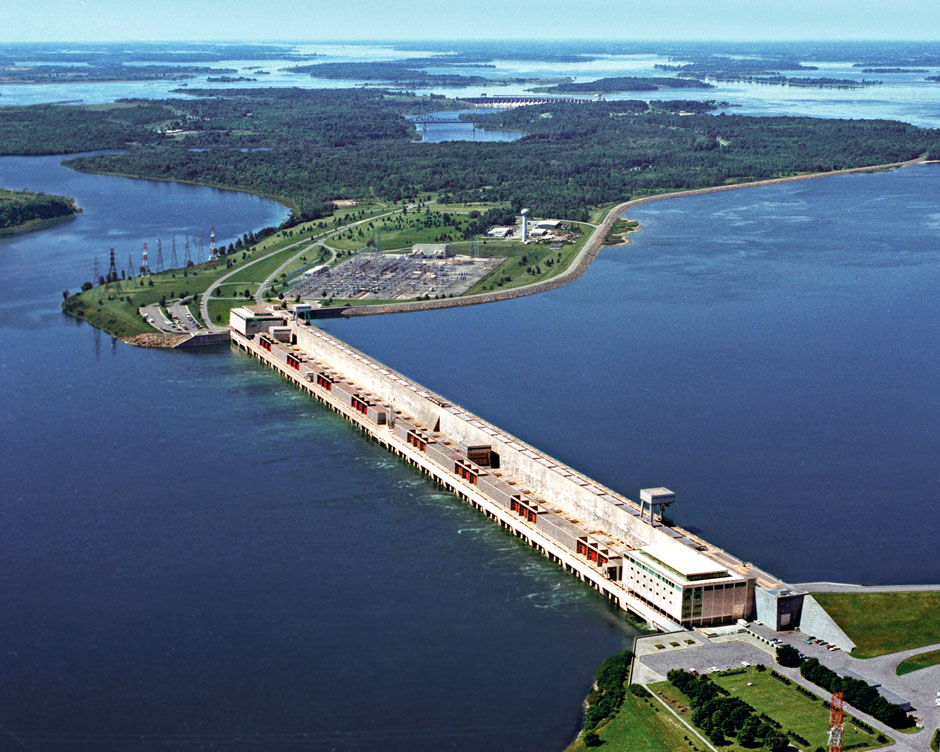 An aerial view of the hydrodam (Photo Credit: New York Power Authority)
Where and how to monitor water quality is always a challenge, particularly in complex aquatic ecosystems. The new REASON Project from a team at Clarkson University is working to demonstrate the utility of using water quality instrumentation in dams on major rivers in the Great Lakes system.
Clarkson University Professor of Biology Michael Twiss spoke with EM about the new approach their team is taking at the Moses-Saunders Power Dam across the St. Lawrence River and the benefits the development of smart infrastructure such as this might offer.
“The upper St. Lawrence River is defined as that which leaves Lake Ontario and is just upstream from the city of Montreal,” explains Dr. Twiss. “That portion that’s shared between Canada and the United States is, by treaty since 1909, considered part of the Great Lakes. I moved here 15 years ago and I was asked, because I was a Great Lakes researcher, to research the river.”
Dr. Twiss found that much about this section of the river remained unknown, so the team began to conduct fundamental studies of how water changes when it flows out of the lake and downstream.
“I started doing a lot of basic limnological studies from boats,” details Dr. Twiss. “As you can imagine, you need a big boat, because it’s the 13th largest river in the world. It’s really interesting, because it’s not like the Mississippi River that starts off as a trickle somewhere, the St. Lawrence starts off as a large river, over 6,500 cubic meters a second.”
One solution might be to deploy data buoys to gather data during the ice-free season, but that was unsatisfying for Dr. Twiss: “What happens in the winter time? The river’s still flowing, still functioning.”
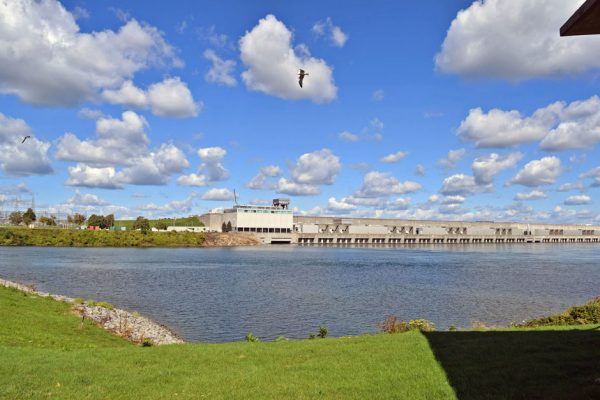
The Moses-Saunders Power Dam. (Photo Credit: New York Power Authority)
“I thought of the 32-turbine Moses-Saunders Power Dam which the entire river flows through,” Dr. Twiss describes. “We can choose various water access points on the powerdam and backtrack to see where the water comes from using hydrodynamic modeling. In other words, we can put our instruments in different parts of the dam to measure different water masses.”
The team now has one such station measuring at the Canadian shoreline, one measuring at the middle of the river, and one on the New York shore.
“At the middle we calculate that the flow is essentially five-day-old Lake Ontario water,” comments Dr. Twiss. “The shoreline stations are able to detect tributary influences, and those are different on the north and south shores—the mass of water coming through actually causes lateral stratification, something characteristic of large rivers. Even though the water’s moving, you don’t get movement of water parcels from one side of the river to the other for hundreds of kilometers. It’s quite something.”
REASON in action
The team’s first sensors were installed on the New York nearshore side of the powerdam in 2014.
“We can start telling stories about what happened during the flooding in 2017, now we can detect that,” remarks Dr. Twiss. “Last year was a relatively normal year, and then suddenly, we’re back to another flood year in 2019.”
The team has also detected more Cyanobacteria biomass than they had ever seen before in that river.
“It may have been related to the flooding that occurred, but 2018 was also the warmest year on record in the water, so maybe that was a connection,” states Dr. Twiss. “There is value in making these long term measurements as part of an ongoing ecological research project, as we can now try to relate any changes in land use, water levels, and climate that might be occurring, to water quality. We are able to observe and try to understand the data that come in, and use it to address various hypotheses.”
Given that there was really no way to monitor in this river year-round before, obviously, these new data on these complex major events make a significant difference for scientists and planners.
“It’s a pretty harsh climate around here in the middle of winter,” Dr. Twiss says. “The river is ice-covered, a high volume of water is flowing, and day length is short, so going out on a boat is not really possible. And buoys out there will just get damaged by ice, so this is really the only way to make these kinds of measurements. It’s opened up a window into what’s occurring in the wintertime.”
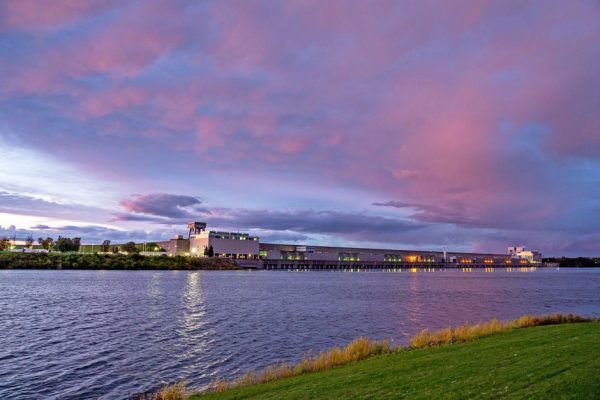
Sunset after a storm over the powerdam (Credit: Philip Kamrass, New York Power Authority)
The partnership between the researchers and stakeholders in the region also makes the project a success.
“The New York Power Authority (NYPA) allows us access to the US-portion of this internationally-shared structure. Because NYPA is a state-owned corporation that gains power from natural resources, part of their mission is to ensure they’re a good corporate citizen,” remarks Dr. Twiss. “We’re also in a partnership with Ontario Power Generation. The two countries share both the waters and the dam, so this is a nice bi-national story—in fact, The River Institute in Cornwall, is a REASON Project partner that is involved with monitoring on the Canadian side.”
The project has also garnered interest from the Electrical Power Research Institute (EPRI) because American eel traverse the dam.
“When eels migrate downstream they must pass through the turbines, and there’s a 40 percent mortality rate every time they make the trip,” Dr. Twiss comments. “There are eel ladders to take eels up the St. Lawrence River, but on the way down they have no safe passage, so the folks at EPRI are interested in the temperature and water quality data over certain times of year because they’re trying to figure out a way of diverting the eels into areas where they can collect them and physically take them around the dam. So our data is being used by other folks for different reasons, and we’re more than happy to share it.”
Details in the dam
Dr. Twiss describes how the water quality monitoring system works inside the dam:
“The water flows down through penstocks into a large, concrete-encased chamber down below. Inside of that is a scroll case, where all the water flows, and then passes down through the turbines, which generate electricity. The generation of electricity is a mechanical process and it each turbine unit generates heat as they spin, so river water is used to dissipate some of the heat.”
River water from the chamber is drawn off in a pipe one foot in diameter for the cooling apparatus – the team taps it off with a stainless steel pipe.
“We step down the pressure, and we pass it through our instruments, which are encased in flow-through chambers on a shelf unit,” says Dr. Twiss. “Then the water goes down into a scupper and returns to the river. Meanwhile, we collect the data.”
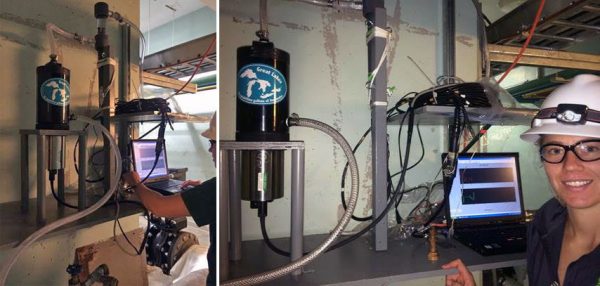
A technician works with the monitoring system at the powerdam. (Photo Credit: Michael Twiss, Clarkson University)
Although the technology is capable of producing real-time data, the unique situation of its dam placement makes that option impossible.
“It’s a secure environment that is highly regulated,” explains Dr. Twiss. “In fact, we’re not allowed to have real-time instrument data output due to cybersecurity concerns. At the same time, I don’t think there’s really a demand for that information at present. In certain places that use river water as source water it’d be nice to have alerts for Cyanobacteria, for example, but I would rather see that instrumentation right there at the municipal water intakes. What we can gather is information on how the river behaves from year to year, so people can pay attention to certain times of the year based on how the river functions.”
In other words, the project is working to acquire a big picture for policy information so that decisions can be made more effectively locally, and municipalities can use better information for planning their own water quality monitoring.
Meanwhile, there are plenty of advantages to a permanent placement inside a dam, too.
“The instrumentation is very well-protected, explains Dr. Twiss. “No sun rays to erode the plastic, there are no great temperature fluctuations.”
Coming next for the team: plans to expand into the St. Marys River, which is the outflow of Lake Superior.
“There are three dams across that river,” details Dr. Twiss. “Two are owned and operated by private companies, and one is a fully automated dam operated by the US Army Corps of Engineers (USACE), so we’re working to establish a network that can monitor the “pulse” on the Great Lakes at both ends of the system.
For now, the system continues to monitor the same water quality parameters it has from the outset of the project.
“Temperature; specific conductivity; fluorescence; in vivo phycocyanin, which is an indicator of Cyanobacteria; colored dissolved organic matter or CDOM and turbidity” Dr. Twiss describes. “When we grab samples, we test for nutrients such as phosphorus and nitrate, as well as sulfate and chloride. In addition, we measure size fractionated of chlorophyll–a so .02 to 2, 2 to 20, and greater than 20 microns. We also measure the phytoplankton community composition using a FluoroProbe which is a multi-spectral fluorometer.”
The team also analyzes their grab samples for mercury, which assessed for its relation to water level changes.
“We’re concerned that high water levels are causing erosion into wetlands, which contain mercury,” adds Dr. Twiss. “The changing water levels can establish redox changes that favor microbes in those environments to methylate mercury, and we think that might be enhancing its bioavailability.”
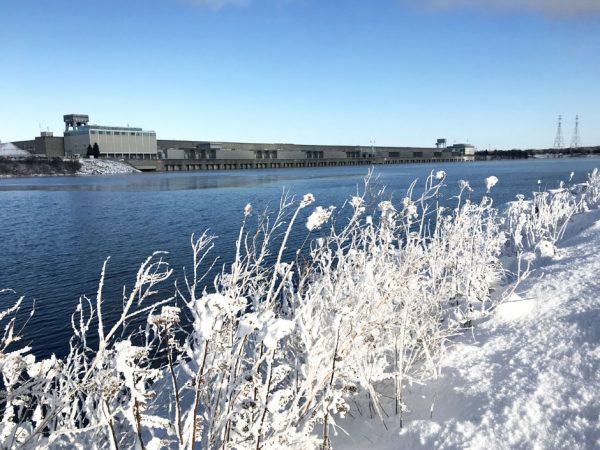
A view of the dam in the winter. (Photo Credit: Michael Twiss, Clarkson University)
Another advantage of monitoring from this kind of fixed station in a large river is the ability to apply hydrodynamic modeling to predict flows more accurately.
“For example, we’re able to detect the spring freshet in the Oswegatchie River that flows out of the Adirondacks,” remarks Dr. Twiss. “We can see the decrease in the salinity of the water, specifically related to the discharge. That river enters the St. Lawrence River 65 kilometers upstream from the dam, so although the impact on water quality is subtle, we’re detecting that tributary. It’s quite noticeable.”
And while the instrumentation is well-protected in its secure site, the team is aware of the current limits to what they can detect.
“For example, you have to consider what’s happening in Lake Ontario, which way the wind’s going, because there are wind-driven currents and other water motion effects,” says Dr. Twiss. “So, because what water mass is actually being entrained into the river at which time can influence what you’re observing in the river, chemical and physical changes in the river don’t change as much as the biological condition changes.”
Meanwhile, the researchers continue to test and improve the systems and the process with the help of their partners.
“Our partners, the power companies, need us to live up to our mantra from the get-go: we’re not going to get in your way, we’ll just run our instruments,” comments Dr. Twiss. “Once in a while they have to stop the water flow for maintenance. We’ve developed scripts to clean up the data and detect when things get shut down automatically. We’re using our system as a test bed right now, and we’re interested in other people using the platform, to further test new instruments.”
One Comment
Leave a Reply


Mahmoud Farhadiroushan
April 15, 2022 at 10:55 am
Thank you for this post, very informative. Not a lot of people realise the level of effort and investments needed in order to monitor a dam efficiently, surprisingly, a lot of people believe they just operate themselves.