USGS maps show nutrient inputs to U.S. estuaries

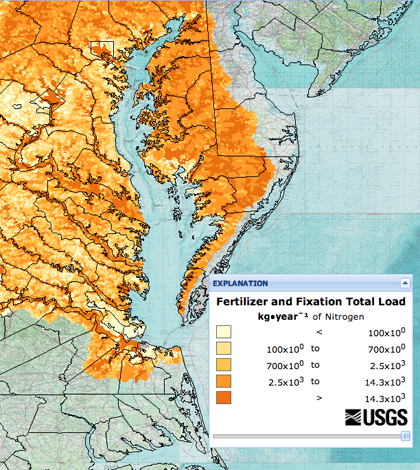
Map of fertilizer and fixation nitrogen load for Chesapeake Bay (Credit: USGS)
The U.S. Geological Survey is providing new interactive maps and tables online to show nutrient inputs to estuaries nationwide, according to Water World. The resources cover 115 estuaries and 160 watersheds.
Much of the data is part of the SPARROW decision support system, developed by the USGS to provide information to water managers and researchers. The system contains data related to estuaries but can be used in other projects.
Officials at the USGS say the combination of mapping and decision tools will help those constructing water quality models. It will also help inform policy decisions on nutrient reduction nationwide.
Image: Map of fertilizer and fixation nitrogen load for Chesapeake Bay (Credit: USGS)


0 comments