
A Drop in the Ocean: Restoring London’s Tidal Thames
The United Kingdom has grappled with wastewater management problems for decades. Although sewage treatment in the 20th century allowed many rivers, including the tidal Thames, to have healthy fish populations, combined sewer overflows into rivers–most commonly during heavy rainfall–affected water quality and occasionally even killed fish.
Problems reached a head in 2012 when multiple infractions of European urban wastewater treatment laws threatened costly fines, on top of the environmental cost of repeated sewage spills into British rivers.
Fast forward to 2025, and after a decade of construction work, London’s Thames Tideway Tunnel, affectionately dubbed the “super sewer”, is now fully activated and ready for testing.
The transformational civil engineering project has delivered a new 25km storage and transfer sewer that tracks the course of the River Thames through the heart of the capital. The new tunnel joins the existing Lee Tunnel, linking the system to Beckton Sewage Treatment Works in East London.
The whole tunnel system has a combined capacity of 1.6 million cubic meters and is expected to reduce sewage spills into the tidal Thames by 95 percent.
Barges on the Thames. Tideway’s use of the river to transport materials has removed thousands of large vehicles from London’s roads. (Credit: Tideway)
Monitoring the Tidal Thames
Environmental monitoring has been a constant companion during the construction phase of the Thames Tideway Tunnel, which is just the latest chapter in a long history of monitoring the tidal Thames.
“I think it’s fair to say that the Thames is one of the best monitored estuaries in the world,” says Neil Dunlop, Senior Environment Officer for the Tidal Thames at the Environment Agency (EA).
The Effects of Polluting Discharges on the Thames Estuary 1964, otherwise known as Technical Paper 11, forms the foundation of modern understanding and monitoring in the Thames. “That’s what helped to explain to us how the tidal Thames works. The complex interactions between tides, freshwater, temperature and polluting discharges, and then how to measure the effects.”
“Before the improvements, there were regular fish kills on the Thames due to storm sewage discharging into the river”, states Neil. “It’s not like a normal fluvial river where pollution is flushed downstream. Here it comes back on the tide, concentrates up, causing the dissolved oxygen to drop which is a major problem.”
“It was critical that we had the automatic monitoring stations so we could monitor the fate of that polluting load and quantify the problems,” he stresses.
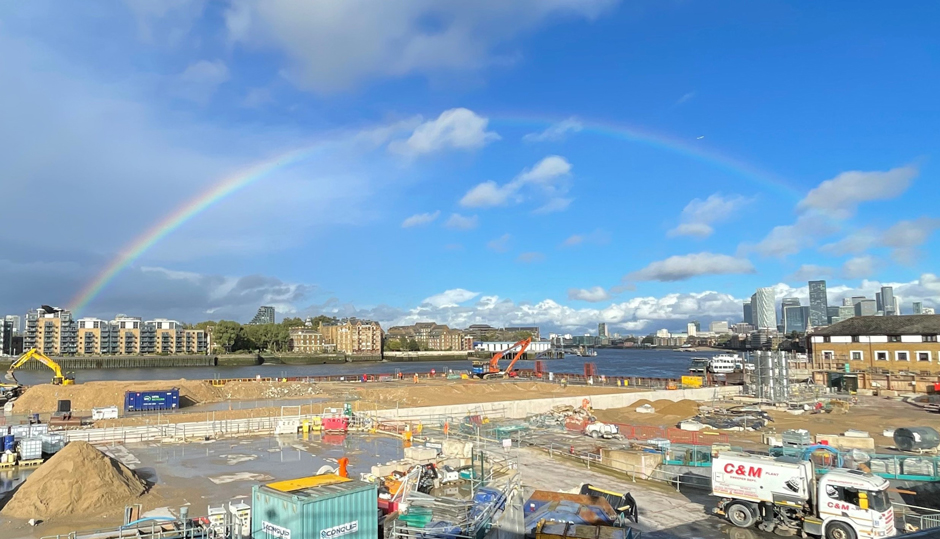
A rainbow crosses the Thames and construction site Chambers Wharf, Bermondsey, one of the four main drive sites on the Thames Tideway Tunnel project. (Credit: Martin Griffiths)
Real-Time Data to Inform Interventions
Thames Water, the utility company responsible for London’s sewage infrastructure, had two main solutions for drops in dissolved oxygen during sewage spills, hydrogen peroxide dosing and oxygenation via bubblers or aerator boats.
“Knowing where to position those on a tide that’s flowing at four or five knots is extremely important. And putting hydrogen peroxide in the right place is critical because if you miss the dissolved oxygen sag you’ve just lost your solution to the problem,” Neil says.
He continues, “Having real-time monitoring is absolutely essential. We currently have a network of nine monitors in the river giving us 15-minute data which is plotted against time (Fig1). We can interrogate that data whenever we want to and so we can watch the dissolved oxygen sags develop and where they’re moving.”
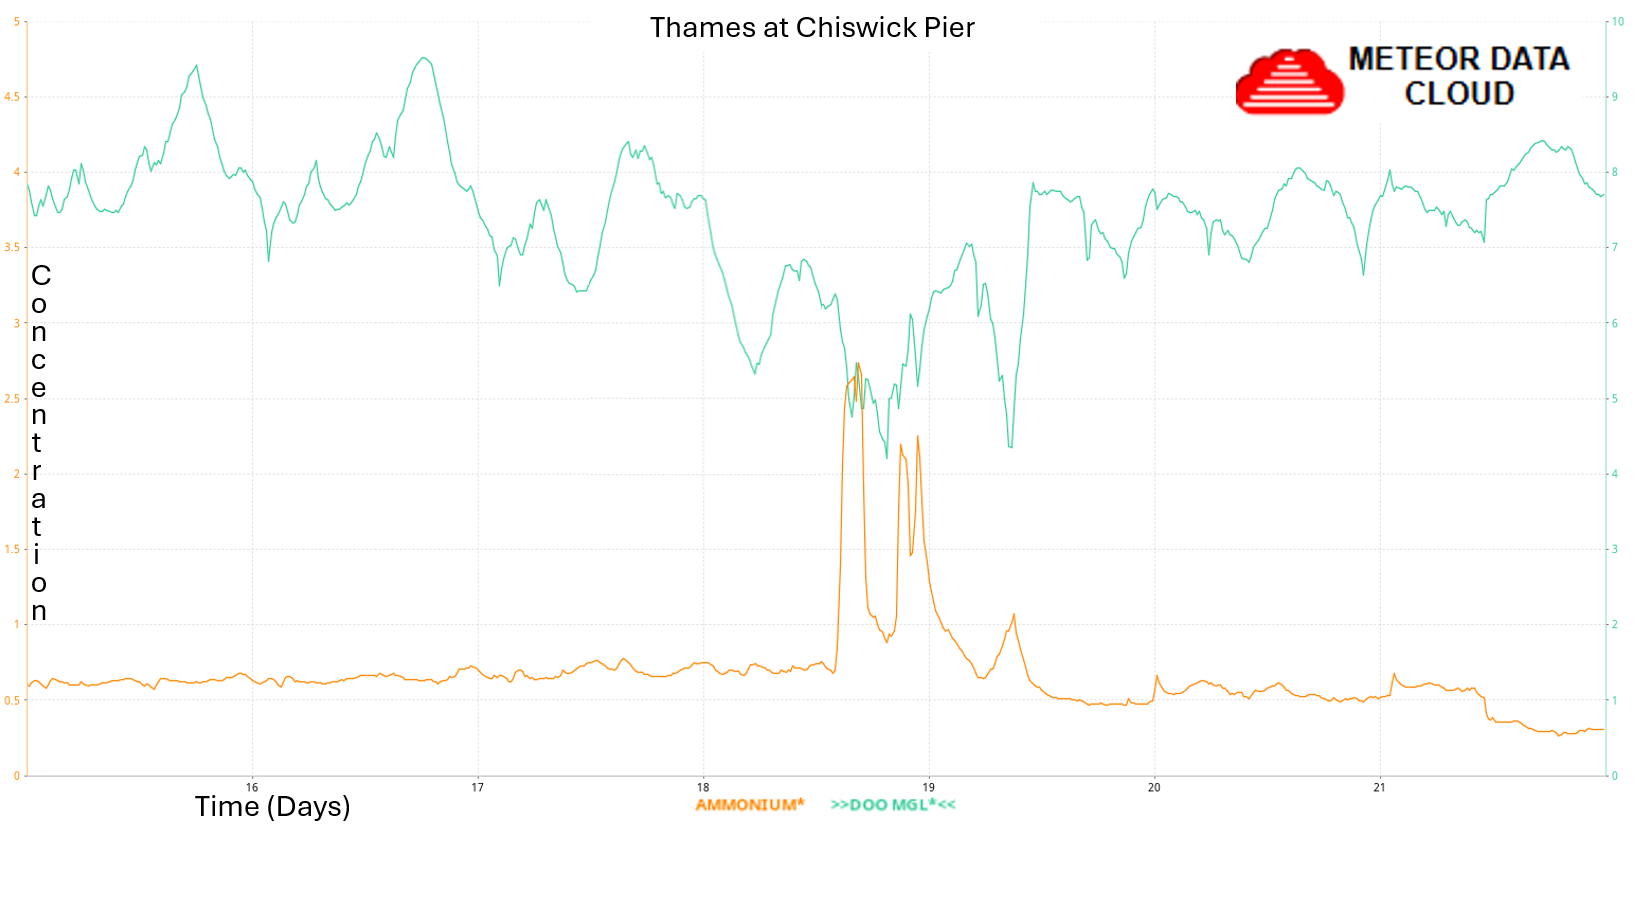
Fig 1: Time series plot of concentration (dissolved oxygen (teal) and ammonium (orange)) versus time. As ammonium from storm sewage increases, dissolved oxygen is stripped from the water. Many other variables also affect the concentrations against time. (Credit: Environment Agency)
To account for net water movement with the tides, data is half tide corrected to produce zoned half tide data plots (Fig 2). These help to geographically fix data and identify where interventions need to be made during a sewage spill. These monitors are produced, and data handled by Meteor Communications.
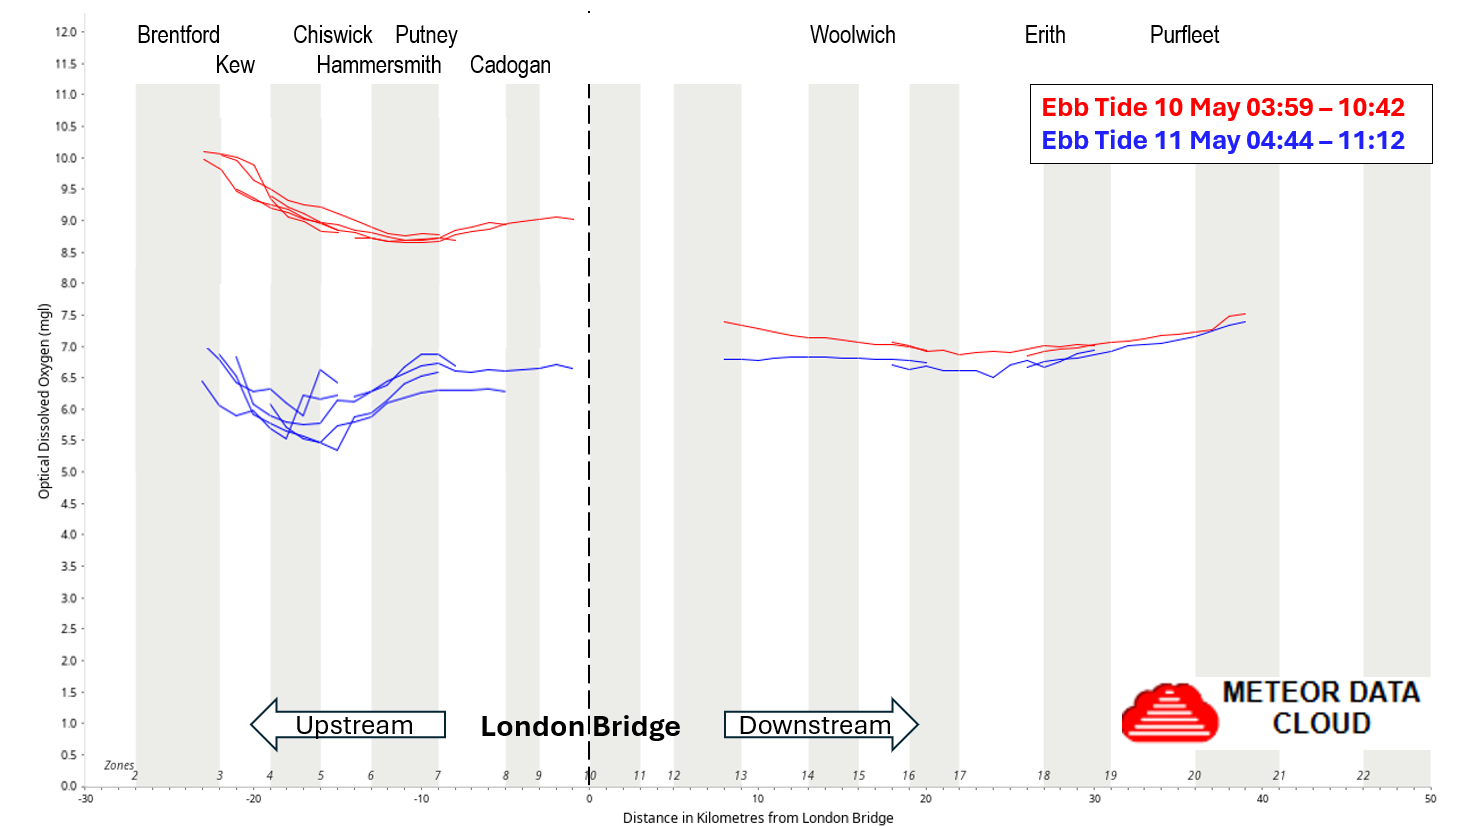
Fig 2: A half tide corrected plot showing an approximate drop in dissolved oxygen of 3mg/l in 24 hours due to storm sewage discharges. The plot lays multiple concentration (y-axis) against time (x-axis) lines onto a distance (x-axis) plot with London Bridge at zero km. (Credit: Environment Agency)
Most Thames monitoring happens remotely, but the team still does a monthly river run to collect physical samples for mandatory monitoring, looking for metals, organic chemicals, pesticides, and more.
Multi-parameter probes on floating platforms send data remotely and require changing approximately monthly. Dissolved oxygen, pH, turbidity and conductivity (salinity) are measured on every sonde. Ammonia–an indicator of sewage discharge–is only tested further upstream where there is less interference with salinity and discharges are more concentrated.
Environmental Monitoring and the Thames Tideway Tunnel
The conversations that led to the project started as far back as 2000. Neil is confident of the role data played in understanding the scale of the problem and inspiring action, stating, “Real-time monitoring which began in the 1980s supported modelling for the Tideway project.”
Ian Moxon, Thames Tideway Tunnel Project Manager for the EA leads the EA team embedded in the project. According to Moxon, there’s been “lots of monitoring data from the construction phase.”
Most monitoring data is from work that is the EA’s bread and butter, including managing flood risk, groundwater quality and sediment migration across the 40 million hours worked on the Thames Tideway Tunnel project.
An advocate for an embedded approach that has enabled the Environment Agency team to become a trusted advisor on the project, Ian explains, “The value worked both ways. The Regulator [Environment Agency], Client [Tideway] and their contractors built up trust and understanding, resulting in a better appreciation of each other’s risks and concerns.”
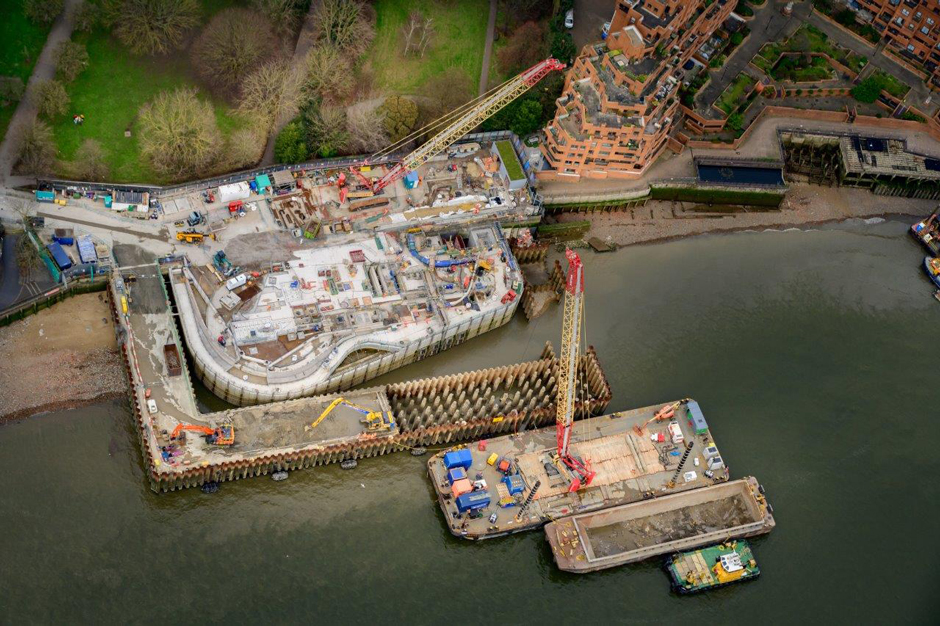
King Edward Memorial Park Foreshore site from above. This site is the location of one of the most polluting sewer overflows into the river. (Credit: Pat Rayner)
A Complex Challenge
Environmental monitoring on this project has been wide-reaching. Ian gives a snapshot of the rich tapestry of data collected that has contributed to our understanding of the Thames and beyond.
He explains, “We understand from the data how river walls move in response to the tide and having big holes dug next to them. Tideway has been monitoring the shape of the river with bathymetric surveys, sonar, radar and laser scans of the river bed to monitor the impact of the works that they’re doing.”
Changes to river flow, scour, and accretion were mapped quarterly while temporary structures were built out into the river. These surveys will continue for at least six years to assess for any long-lasting effects.
In some areas, a combination of geology and construction techniques meant it was necessary to lower groundwater levels while digging shafts, requiring careful monitoring to ensure this did not affect nearby groundwater users.
As a result of monitoring during these works, Ian explains, “We got a much better understanding of the behaviour and interaction of groundwater, surface water, shallow and deep groundwater in the London basin, which was input to the Environment Agency’s London Basin Groundwater Model.”
The Thames is a migratory fishery home to salmon and smelt. “Fish don’t like noise,” Ian says. “This was flagged up during the major cofferdam construction period when there were a lot of Tideway sites being constructed at the same time, the cumulative effect of that is a big noise barrier.”
“There was lots of work done to phase construction works so not everything was happening at the same time and different mitigation methods were used: slow starts and different types of kit, pushing piles in rather than banging them.” Multiple fish rescues were needed when fish sought refuge in the calm waters in unfinished cofferdams.
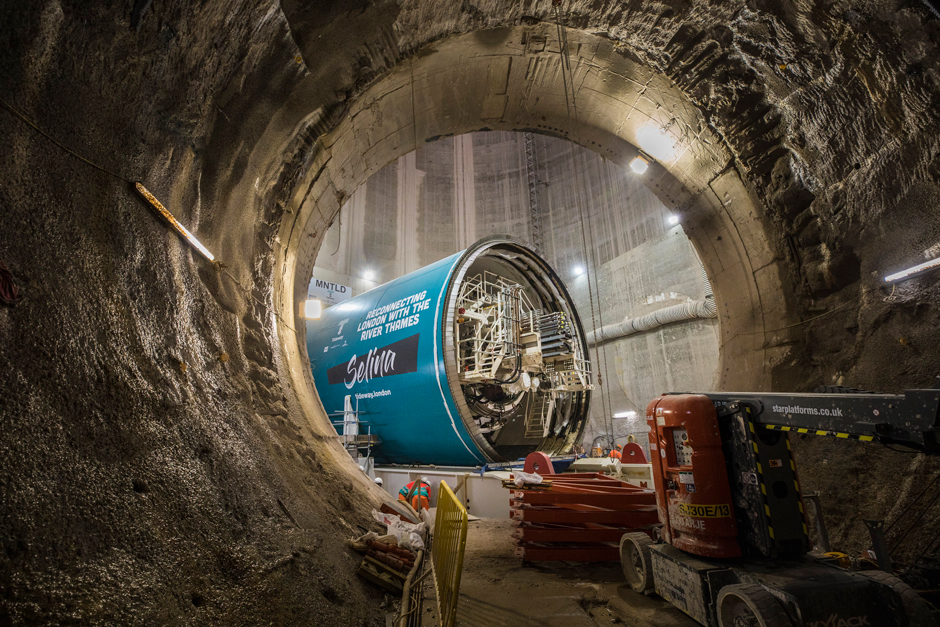
Tunnel Boring Machine at Chambers Wharf. (Credit: Tideway)
What’s Next for the Thames?
As the Thames Tideway Tunnel begins its fully operational life, monitoring will move into a new phase. Testing of tunnel inspection methods is ongoing, with drones and robots expected to play a role–a win for safety and avoiding disruption to service.
Looking to the future, environmental monitoring will be key to assessing the super sewer’s impact. And while it’s expected to be transformational, for Neil, it’s slightly bittersweet: “We won’t be able to justify having so many monitors [in the Thames] because the problems won’t be there any more. When you’ve got such a continuous data record it’s a real shame to start losing those monitors.”
The Thames Tideway Tunnel is just one project that has contributed to creating a cleaner, healthier River Thames. Environmental monitoring has been and will continue to be vital in understanding fluvial health, identifying pressures and informing responses to new and evolving challenges.

Tunnel Boring Machine, “Ursula,” lifted from the site at Chambers Wharf, Bermondsey. (Credit: Tideway)


0 comments