Binational Effort Yields Red River Water Quality Management Tool

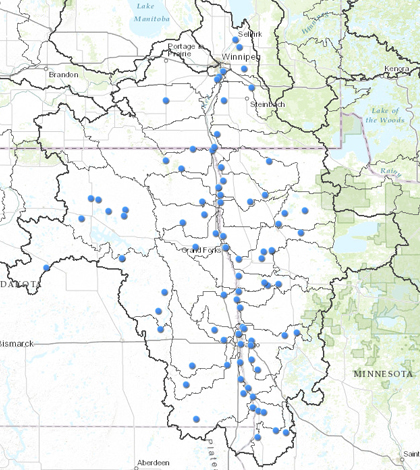
Red River Water-Quality Statistical Summary Story Map. (Credit: U.S. Geological Survey)
The Red River Basin is an important region, both for the United States and Canada. It stretches across two Canadian provinces and the American states of North Dakota and Minnesota. As such, the waters of the Red River have blessed the regions along its banks economically, including the likes of Fargo, Minnesota and Winnipeg, Manitoba.
Given the area’s significance to both nations, the U.S. Geological Survey has joined with the International Joint Commission to make a new tool to help the manage the Red River’s water quality. The tool, called the Red River Water Quality Statistical Summary Story Map, provides information about levels of nutrients, as well as other conditions that indicate water quality in the basin.
Nutrients covered by the story map include nitrogen and phosphorus. In addition, the tool includes information on sulfates, total dissolved solids, specific conductance and total suspended solids. Data are available in one-year, five-year and 10-year increments for all 90 sampling sites going back to 2003.
Also aiding in the tool’s development were officials at the North Dakota Department of Health, the Minnesota Pollution Control Agency, Environment and Climate Change Canada and the Manitoba Conservation and Water Stewardship.
Top image: Red River Water-Quality Statistical Summary Story Map. (Credit: U.S. Geological Survey)


0 comments