Infographic: Invasive Species

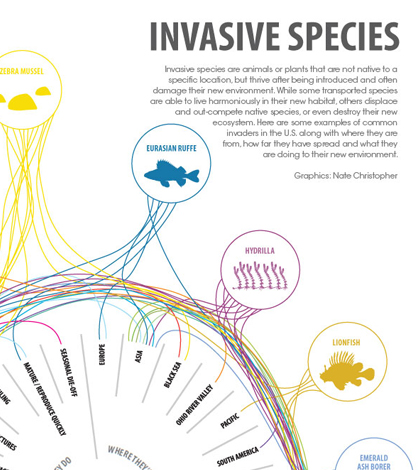
Invasive Species infographic. (Credit: Nate Christopher / Fondriest Environmental)
Our fall 2014 print edition was all about buoys.
From a platform launched off the coast of Erie, Pennsylvania by the Regional Science Consortium to a buoy stationed just outside of the City of Toledo’s water intake crib in Lake Erie, we tried to share with you some of the most current and relevant water quality monitoring projects of the day.
Along the way, we even presented a rundown of some of the prominent buoys floating in the state of Maine and yet another tracking waves off the Marshall Islands’ Majuro Atoll.
Beyond buoys, we got a first look at the FishSens SondeCAM, a high-end underwater camera from FishSens Technology designed for anglers or fisheries researchers looking to identify structure and track water quality at the same time.
Some of our other coverage in this issue featured the School of Ants citizen science project that relied on volunteers and well-placed pecan sandies (cookies) to study ants. We also talked with scientists at the University of Washington studying the effects a dam removal had on the Elwha River’s water quality. And we featured YSI’s ProDSS, a next-generation handheld meter with sensors that can be used in any port.
In addition, our team also put together an outstanding infographic on many of the most common invasive species across the world. These include the likes of the round goby, zebra mussels and lionfish, broken down by their origins, how far they’ve spread and the damage they can inflict. Check out the infographic below.

Invasive Species infographic. (Credit: Nate Christopher / Fondriest Environmental)


0 comments