Extech 3-Axis G-Force USB Datalogger
Features
- USB interface for easy set-up and data download
- Records and times 3-axis shock and peaks
- Selectable data sampling rate: 50ms to 24 hours
- Free ground shipping
- Expedited repair and warranty service
- Lifetime technical support
- More
The Extech VB300 can measure and record shock and vibration (acceleration) readings over its +/-18g measurement range. This device will record 3-axis g-force and related peaks to provide a history of shock and vibration conditions. The real time clock provides time stamps for all data.
The user can easily configure the logging rate, high/low alarm and start-mode, and download the stored data by plugging the VB300 into a PC's USB port and running the supplied PC software. Measurement data can be plotted, printed and exported for use with other applications such as word processors and spreadsheets. The data logger is supplied with a long-life 1000 hour lithium battery.
The VB300 memory uses a 4MB Flash device that can hold 85,764 peak acceleration samples and 210 freefall samples. Additional features include:
- Selectable X-, Y-, Z-axis or any combination (via software)
- Selectable data sampling rate: 50ms to 24 hours
- Datalogs 85,764 peak acceleration samples
- Manual and Programmable start modes
- User-programmable record threshold
- Long battery life - 1000 hours
- Sensor type: MEMS semiconductor
- Acceleration sampling rate: 200Hz
- Acceleration range: +/-18g
- Acceleration resolution: 0.00625g
- Acceleration accuracy: +/-0.5g
- Bandwidth: 0 to 60Hz
- Sampling rate: 500 ms to 24 hours
- Memory: 4Mbit Flash; 85764 samples (approx. 28588 samples/axis)
- Data format: time stamped peak acceleration, average and peak vector sum
- Dimensions: 3.7x1.1x0.8" (95x28x21mm)
- Weight: 1oz (20g)
- (1) USB Datalogger
- (1) Magnetized/bolt-on mounting base
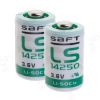
- (1) 3.6V Lithium battery
- (1) Copy of Windows compatible analysis software
In The News
Three Decades of Research at Acton Lake
A multi-disciplinary team at Miami University, Ohio, has been studying the environmental change at Acton Lake for over three decades. Using three different NexSens buoys over this time, the team has an incredible archive of data that is helping build a picture of Acton’s past, present, and future. Until recently, a NexSens CB-50 buoy was used alongside other environmental monitoring at Acton Lake. In May 2025, the Miami team deployed a new XB-200 buoy , future-proofing their ongoing monitoring using real-time buoy systems. Acton Lake, a small hypereutrophic reservoir in southwest Ohio, covers 2.4km² and has a maximum depth of about 8m. The dam was built in 1956, and the lake has a large agricultural watershed.
Read MoreSource Water Monitoring in Albany, New York: Tracing Water Quality throughout Tributaries
Thousands of US cities pull their drinking water from natural source waters like reservoirs, rivers, and streams, making overall watershed health a key consideration for water providers. In Albany, New York, the Albany Department of Water and Water Supply delivers drinking water to over 100,000 residents as well as monitors and manages the larger drinking water supply watershed. Hannah Doherty, Environmental Specialist at the Albany Department of Water and Water Supply , spends her days working with a small team to monitor the drinking supply and the connected water bodies. Doherty explains, “We’re the first to encounter the water that ends up being the drinking water.
Read MoreWildfire Prevention in the Sierra Nevada Region with the Yuba Watershed Institute
Though recent wildfires have sparked new conversations about wildfire management and response, groups like the Yuba Watershed Institute have been monitoring the forests and water resources of the Sierra Nevada region for decades, managing approximately 5,000 acres of land with the Bureau of Land Management (BLM) and about 7,000 acres in private land partnerships. The goal of the Institute is to work with local communities and land agencies to improve watershed and forestry management through informed practices and public outreach. The goals of the Yuba Watershed Institute are three-fold: Improve the ability of fire suppression agencies like the California Department of Forestry and Fire Protection ( CAL FIRE ) and the US Forest Service.
Read More


