Onset HOBO Multi-Channel Data Loggers
Features
- External analog input for a variety of additional sensors
- Optional self-describing sensors with automatic configuration
- Connect via Bluetooth within 100 feet
- Expedited repair and warranty service
- Lifetime technical support
- More
Overview
The Onset HOBO MX Analog/Temp/RH/Light (MX1104) and HOBO MX 4-Channel Analog (MX1105) data loggers measure and transmit data wirelessly from indoor environments to a mobile device or computer using Bluetooth Low Energy technology.
Mechanics
The MX1104 model has integrated temperature, relative humidity (RH), and light intensity sensors and one analog input, while the MX1105 model has four analog inputs. Both models support a wide variety of external sensors (sold separately), including self-describing temperature, split-core AC current transformer, 4-20 mA input, and DC voltage input sensors.
Design
The self-describing sensors are designed with integrated strain relief for a secure connection to the loggers and are automatically detected by the HOBOconnect app for easy setup. These compact loggers also have built-in LCD screens to display current sensor readings, logging status, battery use, memory consumption, and more.
Data Retrieval
Using the app, users can configure the loggers, read out and view data, and export the data for further analysis. The loggers can calculate minimum, maximum, average, and standard deviation statistics and can also be configured to trip audible or visual alarms at thresholds users specify. In addition, both loggers support burst logging, in which data is logged at a different interval when sensor readings are above or below certain limits.
| Temperature Sensor (MX1104) | |||||
| Range | -20° to 70°C (-4° to 158°F) | ||||
| Accuracy | ±0.20°C from 0° to 50°C (±0.36°F from 32° to 122°F) | ||||
| Resolution | 0.002°C at 25°C (0.004°F at 77°F) | ||||
| Drift | <0.1°C (0.18°F) per year | ||||
| RH Sensor* (MX1104) | |||||
| Range | 0% to 100% at -20° to 70°C (-4° to 158°F); exposure to conditions above 95% may temporarily increase the maximum RH sensor error by an additional 1% | ||||
| Accuracy | ±2.5% from 10% to 90% (typical) to a maximum of ±3.5% including hysteresis at 25°C (77°F); below 10% and above 90% ±5% typical | ||||
| Resolution | 0.01% | ||||
| Drift | <1% per year typical | ||||
| Response Time (MX1104) | |||||
| Temperature | 11 minutes in air moving 1 m/s (2.2 mph) | ||||
| RH | 30 seconds to 90% in airflow of 1 m/s (2.2 mph) | ||||
| Light Sensor (M1104) | |||||
| Range | 0 to 167,731 lux (15,582 lum/ft2) | ||||
| Accuracy | ±10% typical for direct sunlight (see Light Measurement on page 4 for more details) | ||||
| Logger with Cable Type |
SD-MA-420 or CABLE-4-20mA | SD-VOLT-2.5 or CABLE-2.5-STEREO | SD-VOLT-05 or CABLE- ADAP5 |
SD-VOLT-10 or CABLE-ADAP10 | SD-VOLT-24 or CABLE-ADAP24 |
| Measurement Range | 0 to 20.1 mA | 0 to 2.5 V | 0 to 5.0 V | 0 to 10 V | 0 to 24 V |
| Accuracy | ±0.001 mA ±0.2% of reading | ±0.1 mV ±0.1% of reading | ±0.2 mV ±0.3% of reading | ±0.4 mV ±0.3% of reading | ±1.0 mV ±0.3% of reading |
| Resolution | 0.3 µA | 40 µV | 80 µV | 160 µV | 384 µV |
| Logger | |||||
| Operating Range | -20° to 70°C (-4° to 158°F) | ||||
| Radio Power | 1 mW (0 dBm) | ||||
| Transmission Range | Approximately 30.5 m (100 ft) line-of-sight | ||||
| Wireless Data Standard | Bluetooth Low Energy (Bluetooth Smart) | ||||
| Logging Rate | 1 second to 18 hours | ||||
| Logging Modes | Fixed interval (normal, statistics) or burst | ||||
| Memory Modes | Wrap when full or stop when full | ||||
| Start Modes | Immediate, push button, date & time, or next interval | ||||
| Stop Modes | When memory full, push button, date & time, or after a set logging period | ||||
| Restart Mode | Push button | ||||
| Time Accuracy | ±1 minute per month at 25°C (77°F) | ||||
| Battery Type | Two AAA 1.5 V alkaline batteries, user replaceable | ||||
| Battery Life | 1 year, typical with logging interval of 1 minute and Bluetooth Always On enabled; 2 years, typical with logging interval of 1 minute and Bluetooth Always On disabled; and temperatures between 0° and 50°C (32° and 122°F). Faster logging intervals and statistics sampling intervals, burst logging, remaining connected with the app, excessive downloads, and paging may impact battery life. | ||||
| Memory | 4 MB (1.9 million measurements, maximum) | ||||
| Full Memory Download Time | Approximately 4 to 15 minutes depending on the mobile device; may take longer the further the device is from the logger | ||||
| LCD | LCD is visible from 0° to 50°C (32° to 122°F); the LCD may react slowly or go blank in temperatures outside this range | ||||
| Size | 11.28 x 5.41 x 2.92 cm (4.44 x 2.13 x 1.15 in.) | ||||
| Weight | 123 g (4.34 oz) | ||||
| Environmental Rating | IP54 | ||||
Select Options


In The News

Sargassum Surge: How Seaweed is Transforming our Oceans and Coastal Ecosystems
Until recently, Sargassum –a free-floating seaweed–was distributed throughout the Sargasso Sea , the north Caribbean Sea, and the Gulf of Mexico. But in the space of a decade, this seaweed has, as one scientist remarks , “Gone from a nonfactor to the source of a terrible crisis.” Driven by climate change, anomalous North Atlantic Oscillation in 2009-2010 and a glut of anthropogenic pollutants, sargassum has proliferated. Seasonally recurrent mats as deep as 7m now bloom in the “Great Atlantic Sargassum Belt” (GASB), which covers areas of the Atlantic from West Africa to the Caribbean Sea and Gulf of Mexico. Every year, millions of tons wash up along the shores of more than 30 countries . Dr.
Read More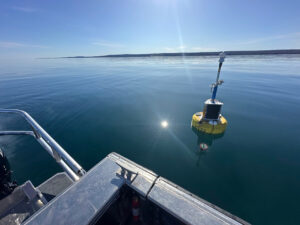
Great Lakes Research Center: Designing Targeted Monitoring Solutions
According to the National Oceanic and Atmospheric Administration ( NOAA ), the Great Lakes have more miles of coastline than the contiguous Atlantic and Pacific coasts combined and contain 20 percent of the world's freshwater, making it a critical region to protect and conserve. Continuous monitoring and data-informed resource management are key components of managing waters in the region. Hayden Henderson, a research engineer with the Great Lakes Research Center (GLRC), designs and deploys monitoring platforms throughout the Great Lakes. With a background in environmental engineering, Henderson enjoyed the challenge of creating systems and making them work to obtain difficult, remote measurements.
Read More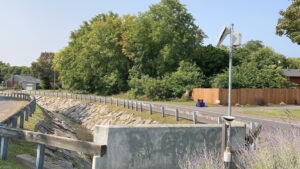
Monitoring Meadowbrook Creek: Real-Time Data Collection in an Urban Creek
Meadowbrook Creek in Syracuse, New York, has been monitored by Syracuse University (SU) faculty and students for over a decade. Originally established by Dr. Laura Lautz in 2012, the early years of the program focused on collecting grab water samples for laboratory analysis and evaluating the impact of urban land use, human activities, and natural processes on water resources. Tao Wen , an Assistant Professor in SU’s Department of Earth and Environmental Sciences, took over the program in 2020 and upgraded the existing systems to include 4G modems that allowed for real-time data viewing. [caption id="attachment_39339" align="alignnone" width="940"] An overview of the Fellows Ave monitoring station along Meadowbrook Creek.
Read More