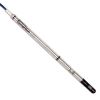
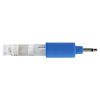
HOBO pH Logger
Features
- Rugged PVC housing for deployment in both freshwater and saltwater environments
- Quick and easy data offload via Bluetooth Low Energy (BLE) to iOS and Android devices
- Guided pH calibration following on-screen prompts in HOBOmobile app
- Free ground shipping
- Expedited repair and warranty service
- Lifetime technical support
- More
Overview
The HOBO MX2501 pH and Temperature Data Logger is designed for long-term monitoring of pH in estuaries, lakes, streams, rivers, and oceans. Leveraging Bluetooth Low Energy (BLE) technology, the MX2501 pH Logger communicates wirelessly with the free HOBOmobile app on iOS and Android devices, making logger setup, calibration, and data offload quick and easy.
Mechanics
The guided pH calibration process on the HOBOmobile app makes an otherwise complicated process easier to follow. Dramatically cuts the time and effort needed to collect field data, while also offering higher resolution data.
Benefits
- Rugged PVC housing for deployment in both freshwater and saltwater environments
- Quick and easy data offload via Bluetooth Low Energy (BLE) to iOS and Android devices
- Water detection system for longer battery life and less maintenance
- Potentiometric pH electrode with plastic body, gel electrolyte, and double cloth junction
- User-replaceable battery, pH electrode, and anti-biofouling copper guard
- Accuracy of ±0.10 pH units within ±10°C of temperature at calibration
| pH Sensor | ||
| pH | mV | |
| Range | 2.00 to 12.00 pH | -512 to 512 mV |
| Accuracy | ±0.10 pH units within ±10°C of temperature at calibration | ±0.20 mV |
| Resolution | 0.01 pH | 0.02 mV |
| Response Time | 1 minute typical to 90% at constant temperature in stirred water | |
| Sample Ionic Strength | ≥ 100 µS/cm | |
| Temperature Sensor | ||
| Range | -2° to 50°C (28.4° to 122°F) | |
| Accuracy | ±0.2°C (±0.36°F) | |
| Resolution | 0.024°C at 25°C (0.04°F at 77°F) | |
| Response Time | 7 minutes typical to 90% in stirred water | |
| Logger | ||
| Operating Range | -2° to 50°C (28.4° to 122°F) — non-freezing | |
| Buoyancy | Fresh water: 13.6 g (0.48 oz) negative Salt water: 19.6 g (0.69 oz) negative |
|
| Waterproof | To 40 m (131.2 ft) | |
| Water Detection | Water conductivity level of 100 µS/cm or greater is necessary for reliable detection of water. Deionized water or water below 100 µS/cm may not be detected. The water conductivity circuit may not reliably detect water that has frozen around the electrodes, i.e. below 0°C (32°F). |
|
| Radio Power | 1 mW (0 dBm) | |
| Transmission Range | Approximately 30.5 m (100 ft) line-of-sight in air | |
| Wireless Data Standard | Bluetooth Low Energy (Bluetooth Smart) | |
| Logging Rate | 1 second to 18 hours | |
| Logging Modes | Fixed interval (normal, statistics) or burst | |
| Memory Modes | Wrap when full or stop when full | |
| Start Modes | Immediate, push button, date & time, or next interval | |
| Stop Modes | When memory is full, push button, date & time, or after a set logging period | |
| Time Accuracy | ±1 minute per month 0° to 50°C (32° to 122°F) | |
| Battery Type | One AA 1.5 Volt, user-replaceable | |
| Battery Life | 1 year typical at 25°C (77°F) with logging interval of 1 minute and Bluetooth Always On selected in software. 2 years typical at 25°C (77°F) with logging interval of 1 minute and Bluetooth Off Water Detect enabled in software. 3 years typical at 25°C (77°F) with logging interval of 1 minute and Bluetooth Always Off selected in software. Faster logging intervals and statistics sampling intervals, burst logging, remaining connected with the app, excessive downloads, and paging may impact battery life. |
|
| pH Electrode Typical Minimum Life | 6 months in sample with ionic strength ≥ 100 µS/cm | |
| Memory | 152 KB (43,300 measurements, maximum) | |
| Full Memory Download Time | Approximately 60 seconds; may take longer the farther the mobile device is from the logger | |
| Dimensions | 22.86 x 4.27 cm (9.0 x 1.68 inches); mounting hole 0.64 cm (0.25 inches) | |
| Weight | 268.2 g (9.46 oz) | |
| Wetted Materials | Logger: PVC housing and sensor end cap, polycarbonate closure caps and mounting end cap with a TPE switch pH electrode: plastic-bodied with Pellon® junctions and gel electrolyte, glass pH sensor bulb |
|
| Environmental Rating | IP68 | |
- MX2501 pH and Temperature Data Logger
- pH electrode
- Bottle of storage solution that can also be used as a storage container for the electrode
- Anti-biofouling copper guard
- Tube of silicone grease
- AA battery
In The News
Monitoring Mariculture in the Gulf of Alaska
The mariculture industry in the Gulf of Alaska has been steadily growing in recent years, guided by ongoing research to help refine farm location and cultivation practices. A subset of aquaculture, mariculture focuses on rearing organisms in the open ocean. In Alaska, finfish farming is illegal, so most farms cultivate kelp, oysters, or a combination of the two. These small, locally operated farms started popping up in the Gulf of Alaska in the early 1990s, when shellfish farming first became legal. Kelp farming did not begin to catch on in the state until 2016. Many of the coastal areas that have grown interested in mariculture are historically commercial fishing communities.
Read MoreSupplying Seattle’s Drinking Water: Using Data Buoys to Monitor the Cedar River Municipal Watershed
Providing clean, safe, and reliable drinking water for the 1.6 million people in the greater Seattle area is a top priority for Seattle Public Utilities (SPU). With limited water supplies, SPU dedicates considerable resources to maintain its watersheds and mountain reservoirs. About 70 percent of Seattle Water comes from the Cedar River Municipal Watershed , and the other 30 percent comes from the South Fork Tolt River Watershed . [caption id="attachment_39574" align="alignnone" width="940"] Data buoy in Chester Morse Lake . (Credit: Kevin Johnson / Seattle Public Utilities) [/caption] Jamie Thompson, a fisheries biologist at SPU, monitors aquatic ecosystems centered on fish listed under the U.S. Endangered Species Act (ESA).
Read MoreData-Driven Advocacy on the Lower Deschutes River
Like many freshwater environments, the Deschutes River in Oregon is under pressure from development, pollution, and climate change. Many rivers, streams and lakes in the Deschutes Basin do not meet Oregon water quality standards –where state water quality monitoring assesses levels of bacteria, pH, dissolved oxygen, temperature, and fine sediment. Hannah Camel is the Water Quality Coordinator for the Deschutes River Alliance (DRA), a non-profit organization that focuses on the health of the lower 100 miles of the Deschutes River–the area most affected by human intervention. As a data-driven organization, the DRA has benefited from the installation of two NexSens X2 data loggers.
Read More


