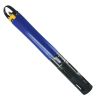
Seametrics Turbo Turbidity Loggers
Features
- Measures turbidity and temperature
- Integrated data logger collects over 260,000 records
- Built-in mechanical wiper reduces cleaning and maintenance requirements
- Free ground shipping
- Expedited repair and warranty service
- Lifetime technical support
- More
Overview
Seametrics' Turbo turbidity logger measures a wide range of NTUs, making it a versatile device capable of deployment at many different sites. The sensor incorporates a mechanical wiper to keep the optics clean during long-term deployments.
Benefits
- Modbus and SDI-12 interfaces for greater flexibility
- Built-in datalogger holds records in non-volatile memory
- RS485 network
- Wireless connectivity
- Flexible, Windows-based programming
- Real-time viewing of data
- Easy export to spreadsheets and databases
- Direct read option for use with panel meters or RTU/PLC applications
- Available with a variety of cable options—including polyethylene, polyurethane, and FEP
- Range: 0-3,000 NTU
- Resolution: ±3 NTU
- Accuracy: 2% at 25° C
In The News
Seametrics Turbo Turbidity Logger: Boost your Turbidity Monitoring
The Seametrics Turbo Turbidity Logger is a self-cleaning turbidity sensor capable of internally logging over 260,000 data records. The sensor enables researchers, compliance officers, and contractors to monitor turbidity in various applications, from construction and dredging sites to wastewater effluent. Due to its narrow width, this device can be deployed in a range of areas, from small well spaces to rivers and streams. The stainless steel housing and built-in wiper allow the sensor to withstand long-term deployments and reduce the need for maintenance trips. The logger accurately records temperature and turbidity up to a depth of 50 meters.
Read MoreFloating Global New Ideas: Buoy-Enabled Research at Florida Agricultural and Mechanical University’s School of the Environment
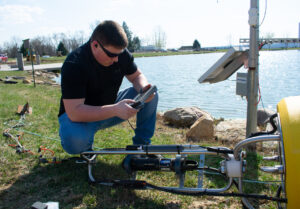
Florida Agricultural and Mechanical University (FAMU), based in Tallahassee, Florida, is the highest-rated public Historically Black College or University in the United States. FAMU’s School of the Environment (FAMU-SOE) offers BS and BA degrees in Environmental Studies, and BS, MS, and Ph.D. degrees in Environmental Science, with specialisms available in areas including Environmental Policy and Risk Management, Aquatic and Terrestrial Ecology, and Biomolecular Sciences. In 2021, FAMU-SOE deployed a NexSens CB-450 buoy in Apalachee Bay, a key oyster farming area around 30 miles south of Tallahassee. The buoy has quickly been incorporated into the curriculum, providing environmental insights for student research, the community, and beyond. Dr.
Read MoreMonitoring Habitat Suitability and Water Quality in Northwest Arkansas Springs
Northwest Arkansas has seen an economic, industrial, and population boom in recent years as a result of expanding businesses, which have created thousands of jobs in the region and the mass migration of employees and construction companies. However, with this growth has come rapid urbanization and the degradation of the natural landscape, specifically the freshwater springs that can be found throughout the region. These springs are critical habitat centers for native wildlife, home to threatened and endangered fish, and those that have yet to be listed. Zach Moran, Assistant Professor of Fisheries Science at Arkansas Technical University, is working to help monitor these habitats and provide key data that will hopefully inform future development in the region.
Read More


