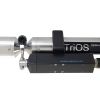
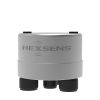
TriOS OPUS UV Spectral Sensor
Features
- Internal compensation for temperature, turbidity, and organic substances
- RS-485 Modbus RTU output for integration with data collection platforms
- Optional W55 V2 wiper cleans optics & reduces maintenance intervals
- Expedited repair and warranty service
- Lifetime technical support
- More
Overview
The TriOS OPUS is a spectral sensor for the online measurement of nitrogen and carbon compounds. By analyzing a full spectrum, OPUS is able to deliver reliable readings for N-NO3, N-NO2, organic ingredients (COD, BOD, DOC, TOC) and a number of other parameters.
Mechanics
Substances with a specific absorption spectrum, such as nitrate and nitrite, can be used directly as elements of the spectral analysis group. For sum parameters, such as COD, BOD, TOC and DOC, theoretical absorption spectra that TriOS has been able to determine over the course of its many years of experience have been stored. Using these parameters, a spectral analysis based on UV absorption can use only the portion that absorbs UV light. Therefore, the OPUS uses only equivalents, and the parameters have the “eq” suffix appended to them, (i.e. CODeq, BODeq, TOCeq and DOCeq). The spectral analysis group also contains correction spectra that take into account, for example, the effects of turbidity. Because the entire absorption spectrum is detected, parameters such as SAC254 (spectral absorption coefficient at 254nm) can also be calculated.
Integration
The OPUS is compatible with the G2 interface box, allowing fast and easy configuration of the sensors using a web browser. The sensor can be easily integrated into existing process control systems and external data loggers using the native RS-485 Modbus RTU output, and the optional W55 V2 wiper reduces maintenance intervals by cleaning the optics before each measurement.
|
Light source
|
Xenon flash lamp
|
|
|
Detector
|
High-end miniature spectrometer
256 Channels
200 to 360 nm
0.8 nm/pixel
|
|
|
Measurement principle
|
Attenuation, spectral analysis
|
|
|
Optical path
|
0.3mm, 1mm, 2mm, 5mm, 10mm, 20mm, 50mm
|
|
|
|
||
|
Parameter
|
Nitrate NO3-N, Nitrite NO2-N, CODeq, BODeq, DOCeq, TOCeq,
TSSeq, KHP, SAC254, COD-SACeq, BOD-SACeq
|
|
|
Measurement accuracy
|
See measurement ranges below
|
|
|
Turbidity compensation
|
Yes
|
|
|
Data logger
|
~ 2 GB
|
|
|
T100 response time
|
2 min
|
|
|
Measurement interval
|
≥ 1 min
|
|
|
|
||
|
Housing material
|
Stainless steel (1.4571/1.4404) or titanium (3.7035)
|
|
|
Dimensions (L x Ø)
|
470 mm x 48 mm (bei 10 mm path)
|
~ 18.5“ x 1.9“ (with 10 mm path)
|
|
Weight stainless steel
|
~ 3 kg (bei 10 mm path)
|
~ 6.6 lbs (with 10 mm path)
|
|
Weight titanium
|
~ 2 kg (bei 10 mm path)
|
~ 4.4 lbs (with 10 mm path)
|
|
|
||
|
Interface digital
|
Ethernet (TCP/IP), RS-232 or RS-485 (Modbus RTU)
|
|
|
Power consumption
|
≤ 8 W
|
|
|
Power supply
|
12...24 VDC (± 10 %)
|
|
|
|
|
|
|
Maintenance effort
|
≤ 0.5 h/month (typical)
|
|
|
Calibration/maintenance interval
|
24 months
|
|
|
System compatibility
|
Modbus RTU
|
|
|
Warranty
|
1 year (EU: 2 years)
|
US: 2 years
|
|
|
||
|
Max. pressure with SubConn
|
30 bar
|
~ 435 psig
|
|
Max. pressure with fixed cable
|
3 bar
|
~ 43.5 psig
|
|
Max. pressure in FlowCell
|
1 bar, 2...4 L/min
|
~ 14.5 psig at 0.5 to 1.0 gpm
|
|
Protection type
|
IP68
|
NEMA 6P
|
|
|
||
|
Sample temperature
|
+2...+40 °C
|
~ +36 °F to +104 °F
|
|
Ambient temperature
|
+2...+40 °C
|
~ +36 °F to +104 °F
|
|
Storage temperature
|
-20...+80 °C
|
~ -4 °F to +176 °F
|
|
Inflow velocity
|
0,1...10 m/s
|
~ 0.33 fps to 33 fps
|
|
Parameter
|
Measurement Principle
|
Unit
|
Factor
|
Path Length (mm)
|
|||||||
|
|
|
|
|
0.3
|
1
|
2
|
5
|
10
|
20
|
50
|
|
|
absorbance
|
spectral
|
AU**
|
-
|
0.01...2.2
|
0.01...2.2
|
0.01...2.2
|
0.01...2.2
|
0.01...2.2
|
0.01...2.2
|
0.01...2.2
|
|
|
absorbance
|
spectral
|
1/m
|
-
|
50...7300
|
15...2200
|
7.5...1100
|
3...440
|
1.5...220
|
0.75...110
|
0.3...44
|
|
|
Nitrate N-NO3
|
spectral
|
mg/L
|
-
|
1.0...330
|
0.3...100
|
0.15...50
|
0.06...20
|
0.03...10
|
0.015...5
|
0,006...2
|
|
|
Nitrate NO3
|
spectral
|
mg/L
|
-
|
4.43...1460
|
1.33...440
|
0.67...220
|
0.27...88
|
0.13...44
|
0.067...22
|
0.030...9
|
|
|
Nitrite N-NO2
|
spectral
|
mg/L
|
-
|
1.7...500
|
0.5...150
|
0.25...75
|
0.1...30
|
0.05...15
|
0.025...7.5
|
0.01...3
|
|
|
Nitrite NO2
|
spectral
|
mg/L
|
-
|
5.6...1650
|
1.65...500
|
0.82...250
|
0.33...100
|
0.17...50
|
0.083...25
|
0.033...10
|
|
|
DOCeq
|
spectral
|
mg/L
|
-
|
17...3300
|
5.0...1000
|
2.5...500
|
1.0...200
|
0.5...100
|
0.25...50
|
0.1...20
|
|
|
TOCeq
|
spectral
|
mg/L
|
-
|
17...3300
|
5.0...1000
|
2.5...500
|
1.0...200
|
0.5...100
|
0.25...50
|
0.1...20
|
|
|
CODeq
|
spectral
|
mg/L
|
-
|
100...7300***
|
30...2200***
|
15...1100***
|
6.0...440***
|
3.0...220***
|
1.5...110***
|
0.6...44***
|
|
|
BODeq
|
spectral
|
mg/L
|
-
|
100...7300***
|
30...2200***
|
15...1100***
|
6.0...440***
|
3.0...220***
|
1.5...110***
|
0.6...44***
|
|
|
KHP
|
spectral
|
mg/L
|
-
|
17...13300
|
5.0...4000
|
2.5...2000
|
1.0...800
|
0.5...400
|
0.25...200
|
0.1...80
|
|
|
SAC254
|
Single wavelength
|
1/m
|
-
|
50...7300
|
15...2200
|
7.5...1100
|
3.0...440
|
1.5...220
|
0.75...110
|
0.3...44
|
|
|
COD-SACeq****
|
Single wavelength
|
mg/L
|
1.46
|
75...10600
|
22...3200
|
11...1600
|
4.4...640
|
2.2...320
|
1.1...160
|
0.44...64
|
|
|
BOD-SACeq*****
|
Single wavelength
|
mg/L
|
0.48
|
24...3500
|
7.2...1050
|
3.6...525
|
1.44...210
|
0.72...105
|
0.36...52.5
|
0.15...21
|
|
|
TSSeq*****
|
Single wavelength
|
mg/L
|
2.6
|
130...4300
|
40...1300
|
20...650
|
8.0...260
|
4...130
|
2.0...65
|
0.8...26
|
|
|
under laboratory conditions
** absorbance unit
*** depending on the composition of the COD and BOD (sum parameter)
**** based on KHP (Note: 100 mg/L COD-standard-solution corresponds to 85 mg/L KHP)
***** based on SiO2
Note:
1 mg/L N-NO3 corresponds to 4.43 mg/L NO3
1 mg/L N-NO2 corresponds to 3.28 mg/L NO2
|
|||||||||||
- (1) OPUS UV Spectral Sensor
- (1) Fitting for compressed air cleaning
- (1) Calibration certificate
- (1) Operations manual
- Note: Included parameters are temperature, SAC254, and TSS. Addtional parameters must be ordered separately as calibrations (see Accessories tab).
Select Options


In The News

Monitoring Mariculture in the Gulf of Alaska
The mariculture industry in the Gulf of Alaska has been steadily growing in recent years, guided by ongoing research to help refine farm location and cultivation practices. A subset of aquaculture, mariculture focuses on rearing organisms in the open ocean. In Alaska, finfish farming is illegal, so most farms cultivate kelp, oysters, or a combination of the two. These small, locally operated farms started popping up in the Gulf of Alaska in the early 1990s, when shellfish farming first became legal. Kelp farming did not begin to catch on in the state until 2016. Many of the coastal areas that have grown interested in mariculture are historically commercial fishing communities.
Read More
Supplying Seattle’s Drinking Water: Using Data Buoys to Monitor the Cedar River Municipal Watershed
Providing clean, safe, and reliable drinking water for the 1.6 million people in the greater Seattle area is a top priority for Seattle Public Utilities (SPU). With limited water supplies, SPU dedicates considerable resources to maintain its watersheds and mountain reservoirs. About 70 percent of Seattle Water comes from the Cedar River Municipal Watershed , and the other 30 percent comes from the South Fork Tolt River Watershed . [caption id="attachment_39574" align="alignnone" width="940"] Data buoy in Chester Morse Lake . (Credit: Kevin Johnson / Seattle Public Utilities) [/caption] Jamie Thompson, a fisheries biologist at SPU, monitors aquatic ecosystems centered on fish listed under the U.S. Endangered Species Act (ESA).
Read More
Data-Driven Advocacy on the Lower Deschutes River
Like many freshwater environments, the Deschutes River in Oregon is under pressure from development, pollution, and climate change. Many rivers, streams and lakes in the Deschutes Basin do not meet Oregon water quality standards –where state water quality monitoring assesses levels of bacteria, pH, dissolved oxygen, temperature, and fine sediment. Hannah Camel is the Water Quality Coordinator for the Deschutes River Alliance (DRA), a non-profit organization that focuses on the health of the lower 100 miles of the Deschutes River–the area most affected by human intervention. As a data-driven organization, the DRA has benefited from the installation of two NexSens X2 data loggers.
Read More